Electrophysiology N-version benchmark - Role of spatial discretization
Module: tutorials.02_EP_tissue.11_discretization.run
Section author: Aurel Neic <aurel.neic@medunigraz.at>
Introduction
The choice of discretization is of major significance for the accuracy of the numerical approximation and thus for the validity of the computed simulation results. This example allows to study the effects of changing spatial and temporal discretizations on the reproduction of a known wedge activation. The setup used here is entirely based on the N-version benchmark study due to Niederer et al [Niederer-Nversion].
Setup
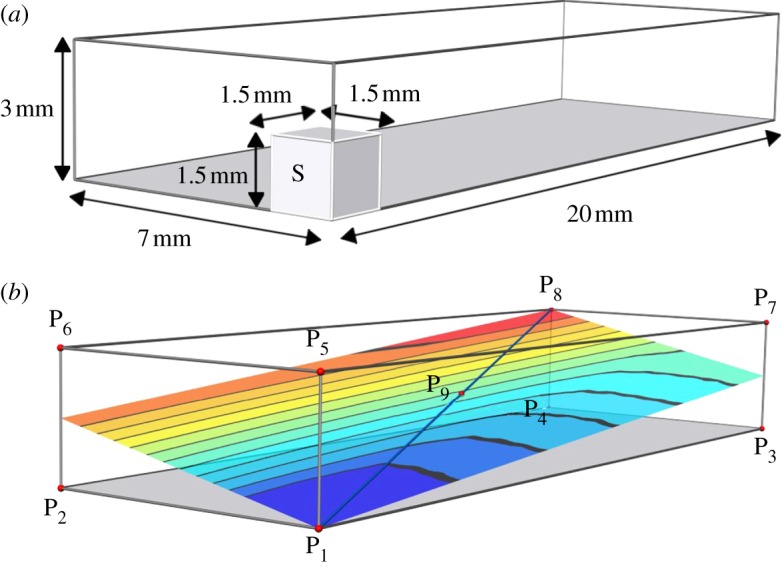
Given is a wedge of 20 x 7 x 3 mm. Starting at one corner, an activation wave propagates across the wedge, arriving last at the opposite corner. The time of activation T(x) of every space-point on the line between the stimulation corner and the opposing corner is plotted. More on the specific details of this benchmark are found here [Niederer-Nversion] along with the benchmark results of the participating codes/groups.
The original figure as used in the publication explaining this setup is shown below in Fig. 115.

Fig. 115 (a)Schematic showing the dimensions of the simulation domain. The stimulus was applied within the cube marked S.
(b) Summary of points at which activation time was evaluated.
Activation times at points  were evaluated and were made available in the
electronic supplementary material.
Plots of the activation time were evaluated along the line from
  and plots of the activation along the plane shown are provided in two dimensions.
Usage
To run the examples of this tutorial do
cd ${TUTORIALS}/02_EP_tissue/11_discretization
To inquire the exposed experimental input parameters run
./run.py --help
which yields the following options:
--sourceModel {monodomain,bidomain,pseudo_bidomain} pick type of source model
--propagation {R-D,R-E+,R-E-,AP-E}
                      pick propagation mode, either full R-D, R-E+, R-E-, or
                      prescribe AP shape with trigger instant
--duration DURATION   duration of experiment, typically 25. for activation
                      only, 400 to include repolarization
--dx DX               resolution of the mesh in um to be used for benchmark
--dt DT               temporal resolution in us
--lump {0,1}          lump mass matrix
--opSplit {0,1}       use operator splitting
--graphPart {on,off}  turn graph partitioning on/off
--plot {0,1}          set to 1 to generate a plot of activation time
                      alongthe wedge's diagonal
--compare             run benchmark with --dx 100 200 and 500 and make
                      comparison plot
The user can either run single experiments, or do a comparison of the multiple
resolutions with the option --compare.
Run example
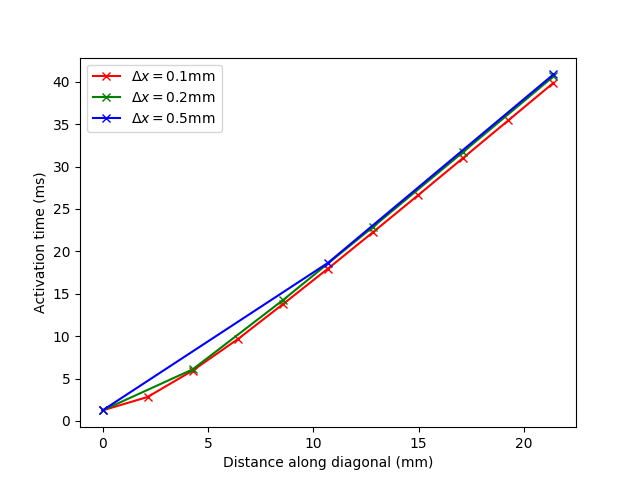
To test the effect of changing spatial resolutions when using the default Reaction-Diffusion propagation model, run:
./run.py --compare --np 8 --propagation R-D
To test the effect of changing spatial resolutions when using the Reaction-Eikonal propagation model, run:
./run.py --compare --np 8 --propagation R-E-
Results plotted when providing the option --compare are shown in Fig. 116.

Fig. 116 Impact of resolution in the N-version Niederer benchmark when using the R-E- model.
References
| [Niederer-Nversion] | (1, 2) Niederer SA, Kerfoot E, Benson AP, Bernabeu MO, Bernus O, Bradley C, Cherry EM, Clayton R, Fenton FH, Garny A, Heidenreich E, Land S, Maleckar M, Pathmanathan P, Plank G, Rodriguez JF, Roy I, Sachse FB, Seemann G, Skavhaug O, Smith NP. Verification of cardiac tissue electrophysiology simulators using an N-version benchmark. Philos Trans A Math Phys Eng Sci. 369(1954):4331-51, 2011. [PubMed] [ [PMC] [Full Text] |