Basic trace visualization using limpetGUI
Module: tutorials.visualization.limpetGUI.run
Section author: Gernot Plank <gernot.plank@medunigraz.at>
Code author: Bernardo Martins Rocha <bernardomartinsrocha@gmail.com>
Trace visualization using limpetGUI
limpetGUI is a simple tool for visualizing traces
output with bench.
It has been developed originally by Bernardo Rocha.
Using bench traces of all state variables can be dumped to binary files
by specifying the --validate option.
If one is interested in a detailed analysis of all traces it is recommended to increase
the temporal resolution using --dt-out which is specified in ms.
For instance, running
bench --imp TT2 --plug-in LandHumanStress --bcl 500 --numstim 100 --duration 2000 --fout=TT2 --dt-out 0.01 --dt 0.01 --validate
dumps all state variable traces of the TT2 model into a number of binary files,
each trace is written at a temporal output resolution of 0.01 ms == 10  .
Each trace is written into a separate binary file.
The header file, in this case named
.
Each trace is written into a separate binary file.
The header file, in this case named TT2_header.txt keeps track of the individual files,
the type and size of data tokens stored in each file.
The header file follows the following format:
0  # is bigendian
             TT2_baseline.Vm.bin       Real            8         11
         TT2_baseline.Lambda.bin       Real            8         11
      TT2_baseline.delLambda.bin       Real            8         11
        TT2_baseline.Tension.bin       Real            8         11
           TT2_baseline.Iion.bin       Real            8         11
              TT2_baseline.t.bin       Real            8         11
           TT2_baseline_TT2.Ca_i GlobalData_t          8         11
           TT2_baseline_TT2.CaSR GlobalData_t          8         11
           TT2_baseline_TT2.CaSS   Gatetype            4         11
             TT2_baseline_TT2.R_   Gatetype            4         11
              TT2_baseline_TT2.O   Gatetype            4         11
           TT2_baseline_TT2.Na_i GlobalData_t          8         11
            TT2_baseline_TT2.K_i GlobalData_t          8         11
              TT2_baseline_TT2.M   Gatetype            4         11
              TT2_baseline_TT2.H   Gatetype            4         11
              TT2_baseline_TT2.J   Gatetype            4         11
            TT2_baseline_TT2.Xr1   Gatetype            4         11
            TT2_baseline_TT2.Xr2   Gatetype            4         11
             TT2_baseline_TT2.Xs   Gatetype            4         11
              TT2_baseline_TT2.R   Gatetype            4         11
              TT2_baseline_TT2.S   Gatetype            4         11
              TT2_baseline_TT2.D   Gatetype            4         11
              TT2_baseline_TT2.F   Gatetype            4         11
             TT2_baseline_TT2.F2   Gatetype            4         11
          TT2_baseline_TT2.FCaSS   Gatetype            4         11
TT2_baseline_LandHumanStress.TRPN GlobalData_t         8         11
TT2_baseline_LandHumanStress.TmBlocked GlobalData_t    8         11
 TT2_baseline_LandHumanStress.XS GlobalData_t          8         11
 TT2_baseline_LandHumanStress.XW GlobalData_t          8         11
TT2_baseline_LandHumanStress.ZETAS GlobalData_t        8         11
TT2_baseline_LandHumanStress.ZETAW GlobalData_t        8         11
TT2_baseline_LandHumanStress.__Ca_i_local GlobalData_t 8         11
Conversion to hdf5
limpetGUI expects hdf5 files as input.
The individual *.bin files output by bench
are dumped into a single hdf5 file using the bin2h5 python script.
All files listed in the corresponding header file
are read in and added to the hdf5 file.
If one is interested only in a subset of state variables
the header file can be modified by simply deleting all file pertaining to state variables
that should not be included and leaving the rest.
Launching the command
# adding binary trace files listed in TT2_baseline_header to hdf5 output file TT2_baseline.h5
#
bin2h5 TT2_baseline_header.txt TT2_baseline.h5
Using limpetGUI
limpetGUI --help

Usage: python main.py [options] hdf5file1 [hdf5file2] [mapfile]
Options:
         -h   --help       print this help message
Comparing traces
Quite often it is of interest to investigate the effect of a given modification upon state variables, be it the modification of some parameters in the model or the impact of changes in the numerical integration such as changing the time step or using a different integrator. limpetGUI reads in two hdf5 files and plots corresponding traces together. For instance, a comparison between the standard TT2 model and a modified TT2-PZ model is shwon in Fig. 169 and Fig. 170.
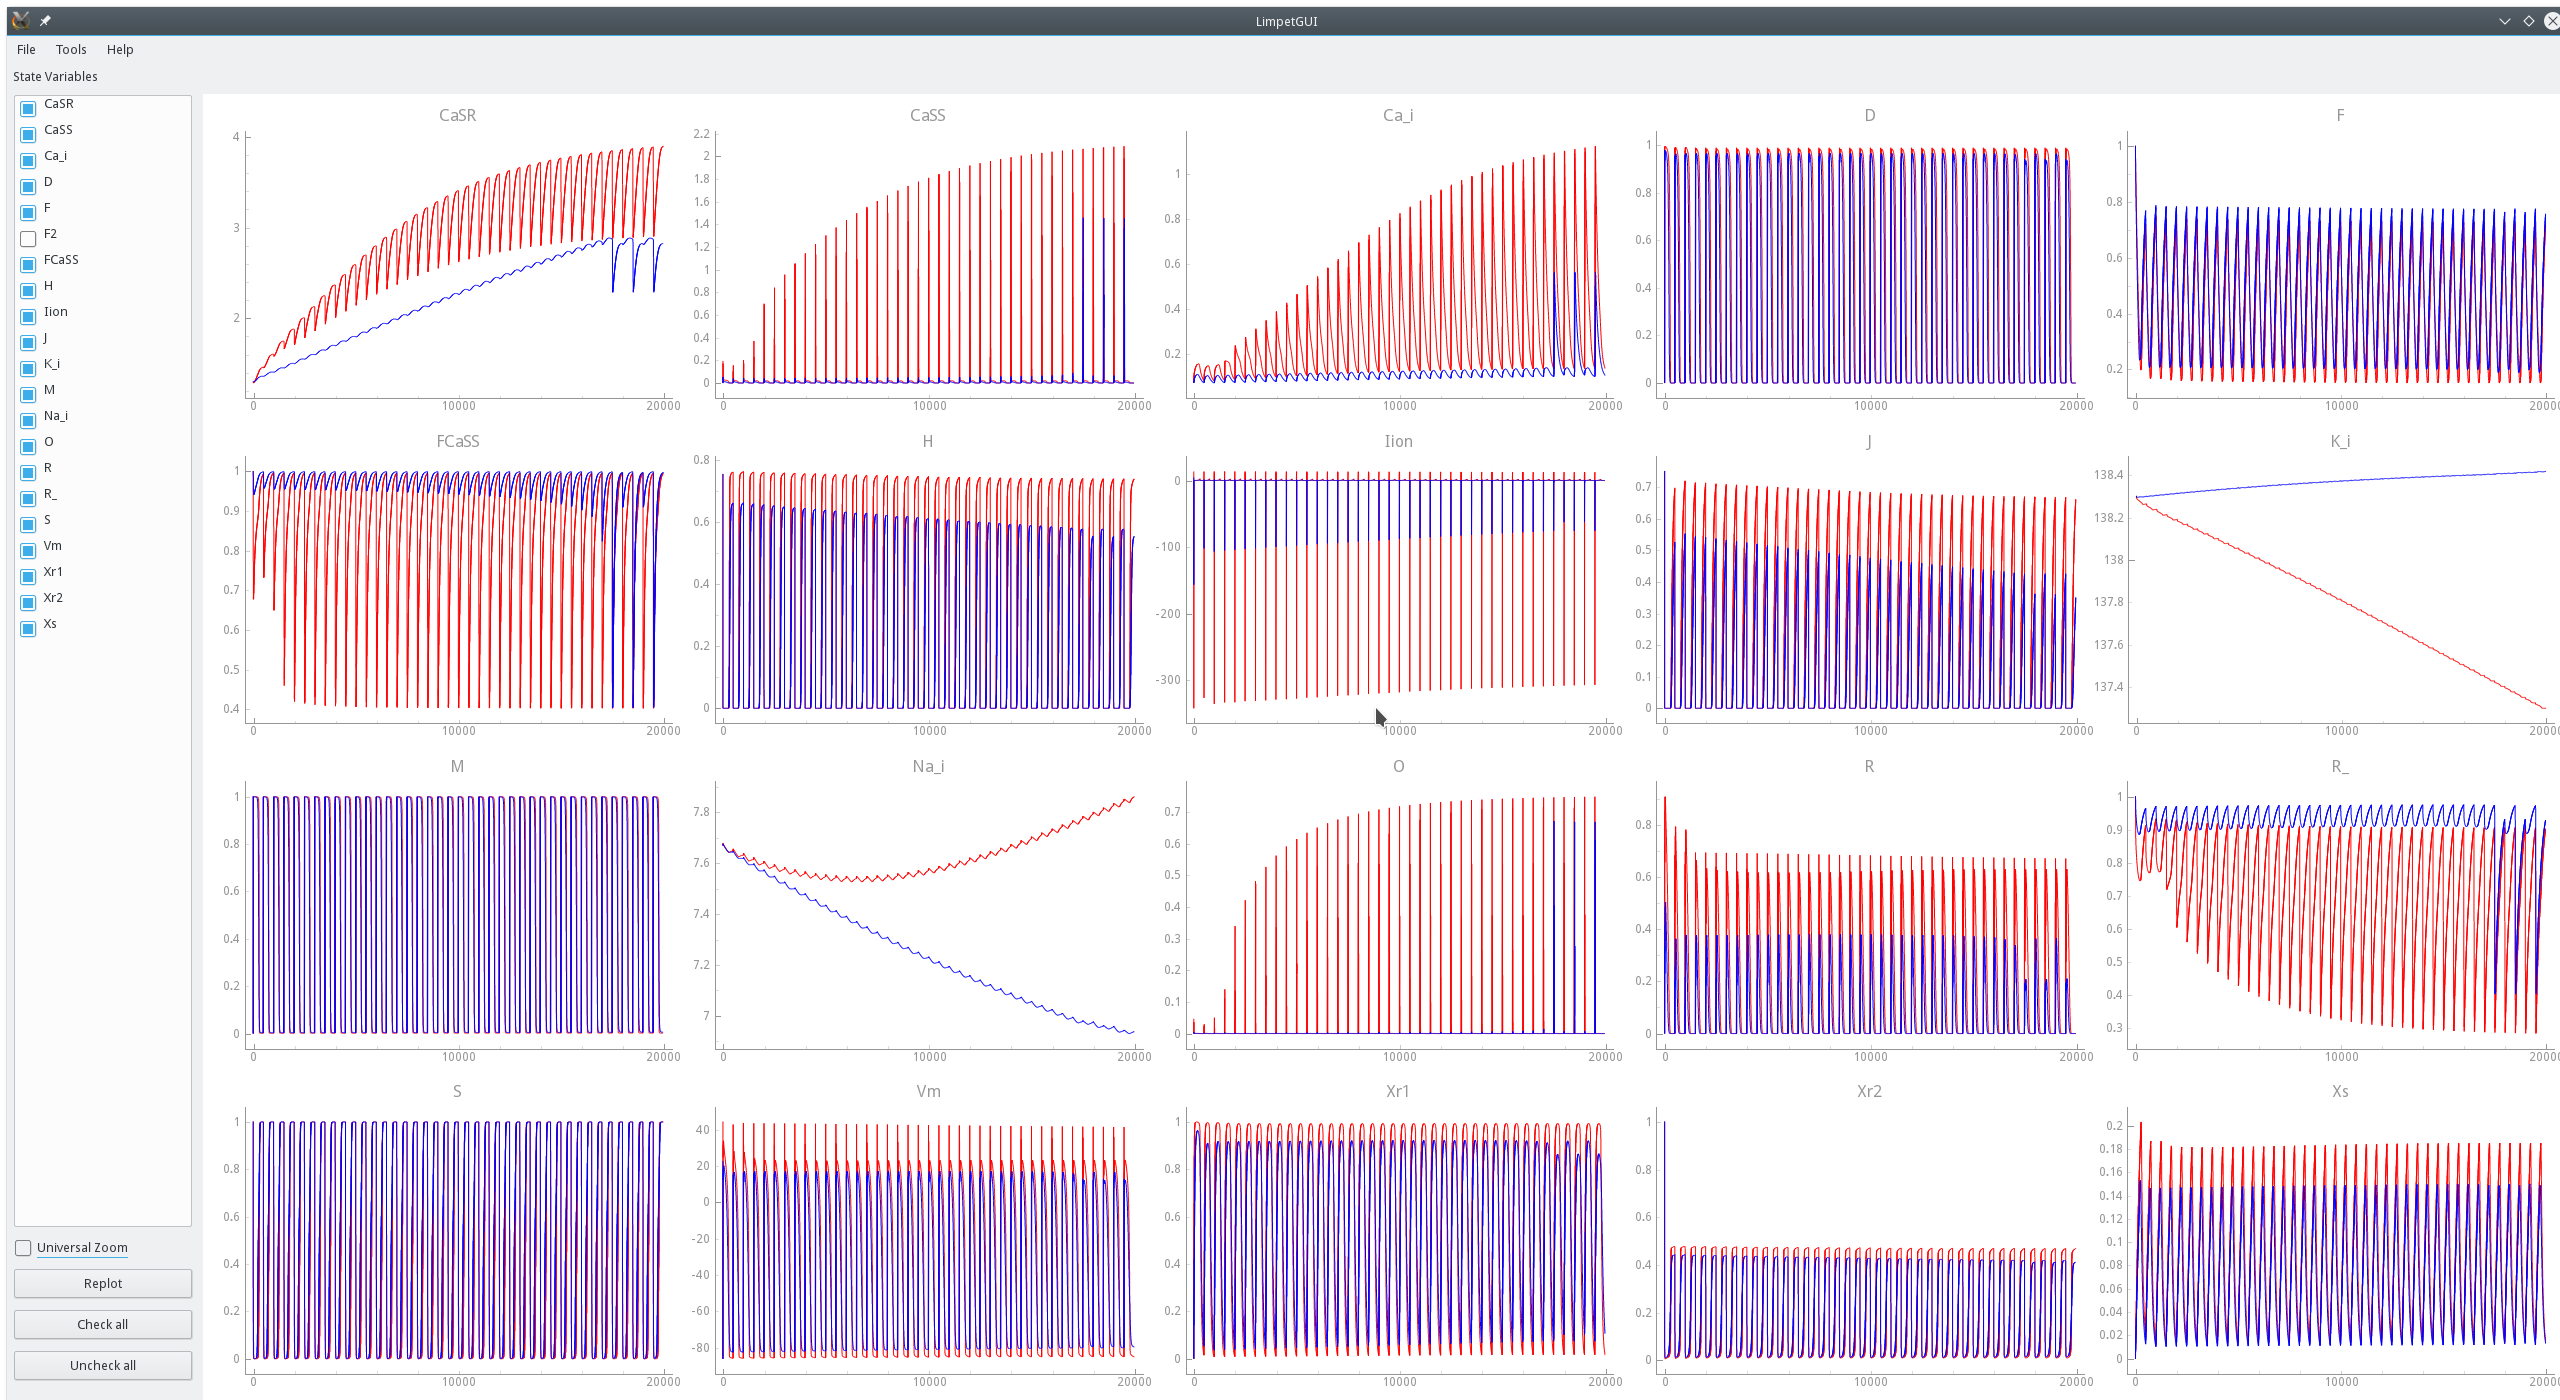
Fig. 169 Comparing state variables of baseline TT2 model (red traces) with modified TT2-PZ model (blue traces). The baseline model approaches a limit cycle whereas the modified TT2-PZ does not showing alternans patterns in Calcium-related state variables.
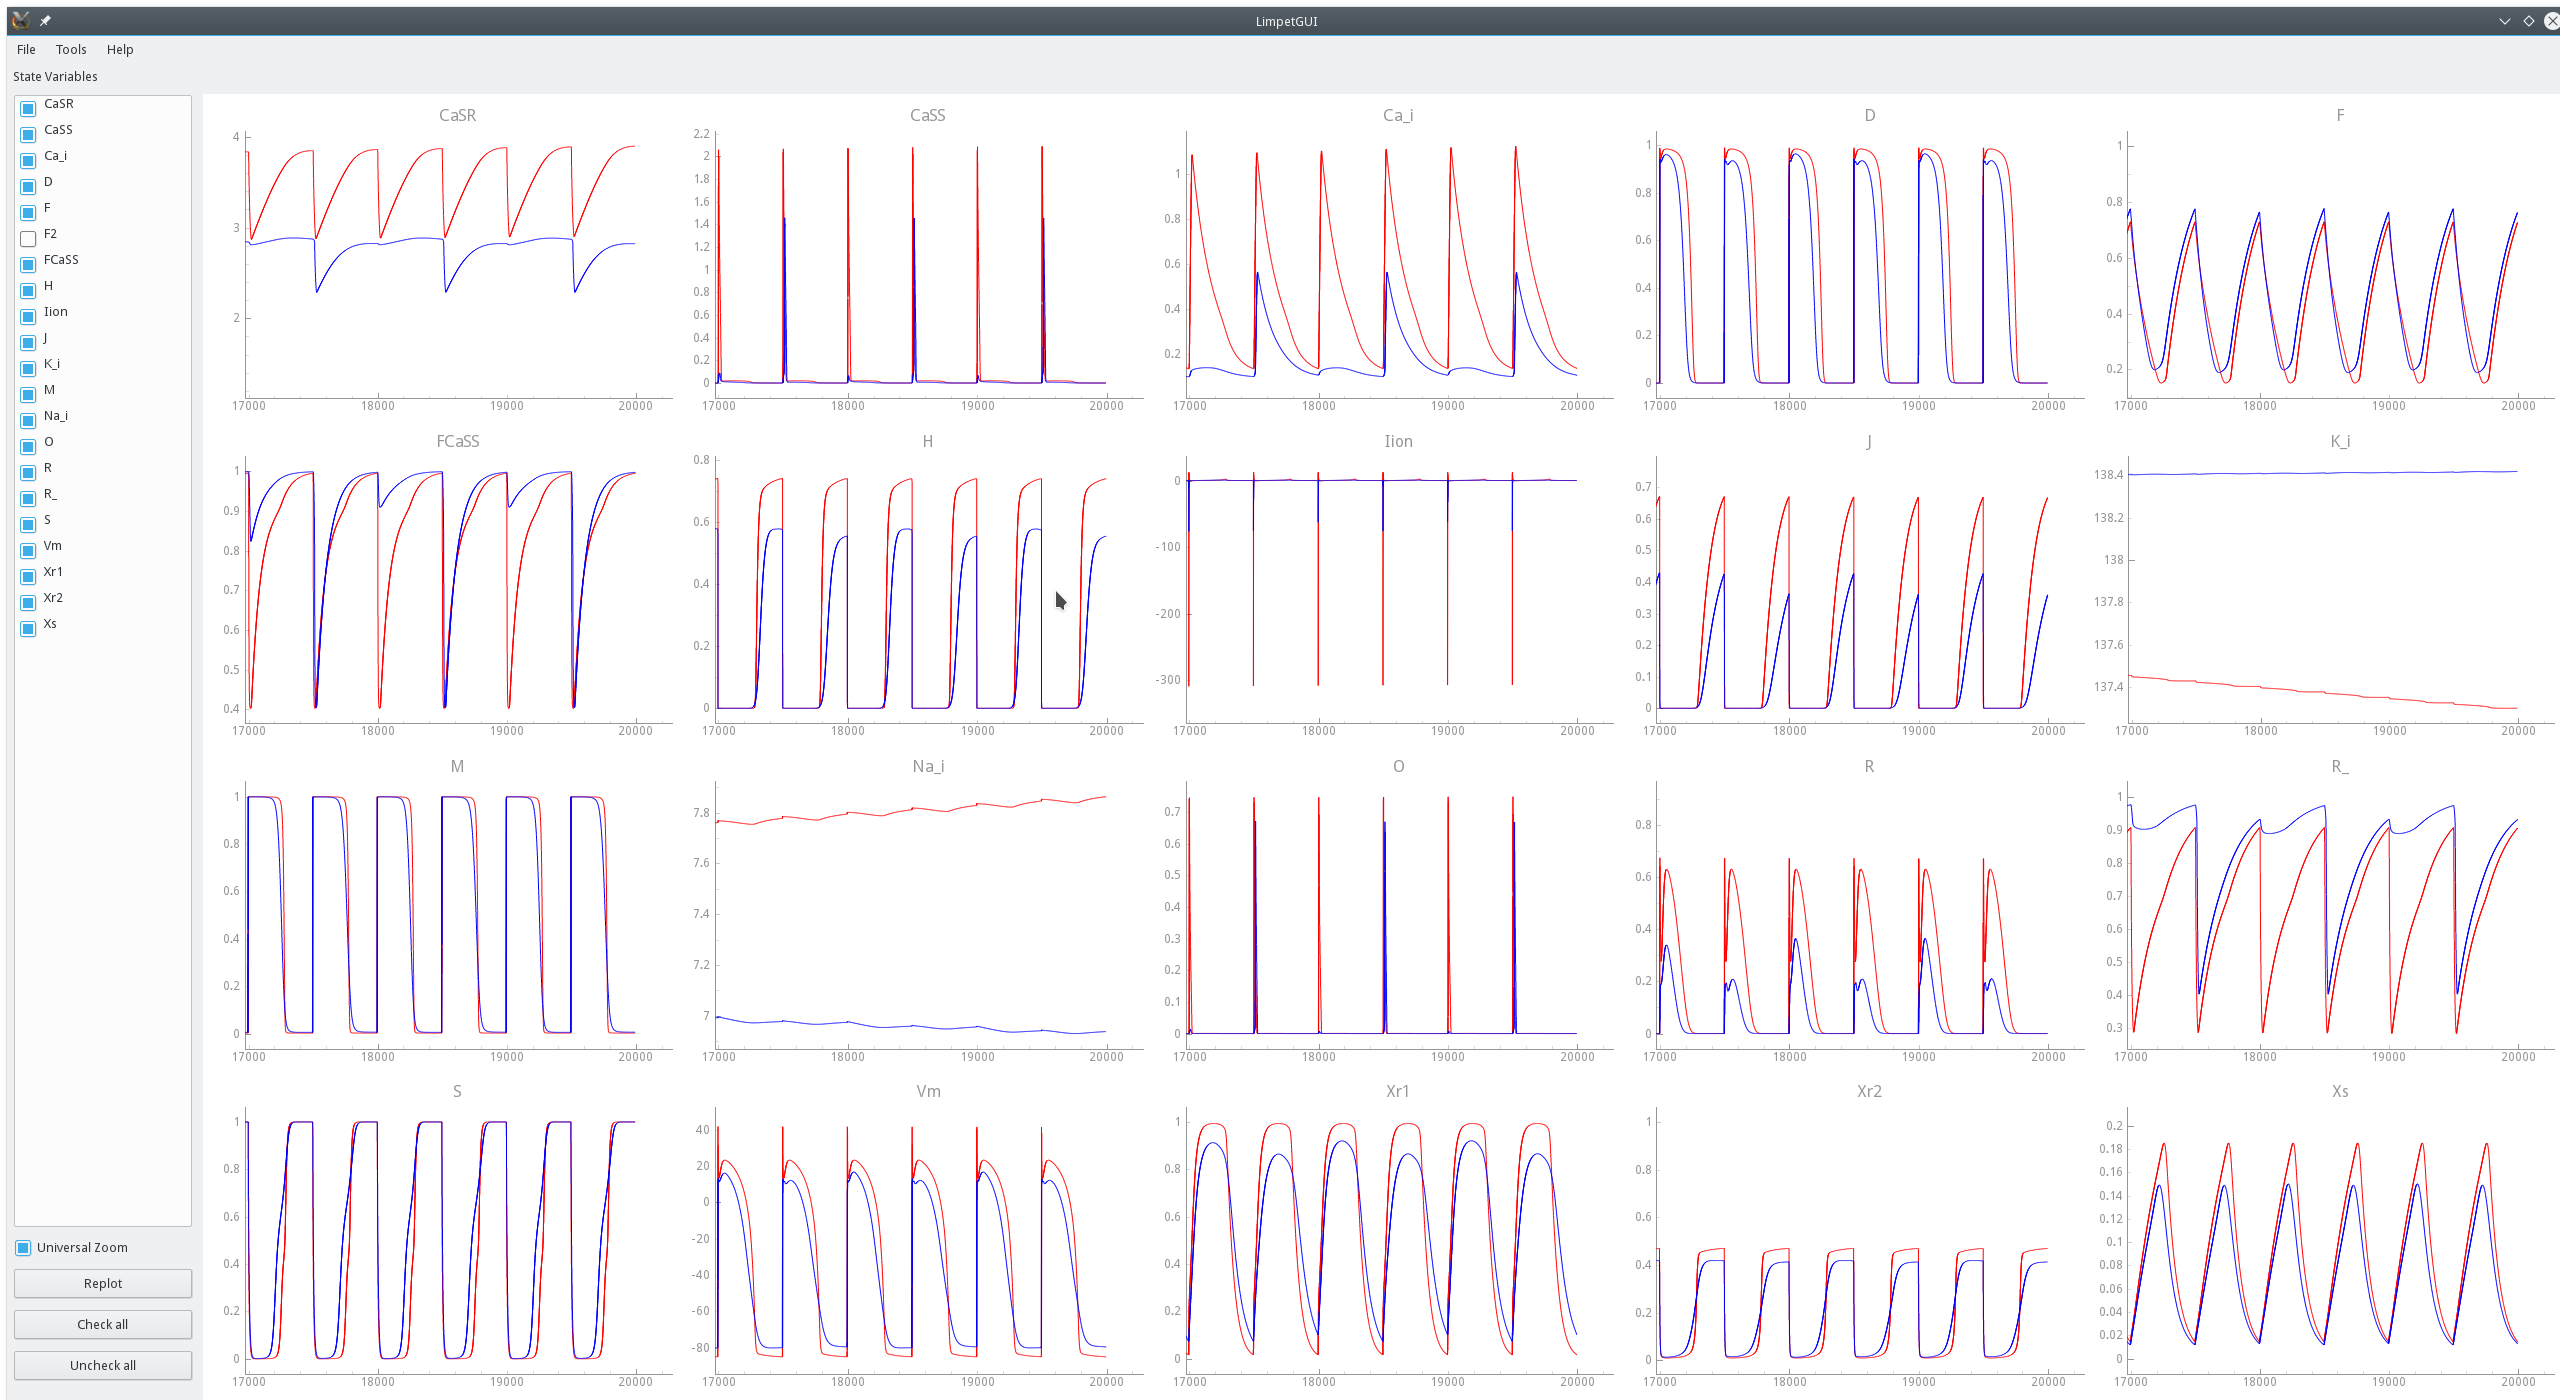
Fig. 170 Comparing all state variables of baseline TT2 model with modified TT2-PZ model as in Fig. 169, but zoomed in on the last 6 cycles of the pacing protocol.
In Fig. 171 the effect of altering the integration time step upon state variable traces is shown. While the overall behavior remains largely unaffected noticeable deviations are witnessed in some state variable traces.
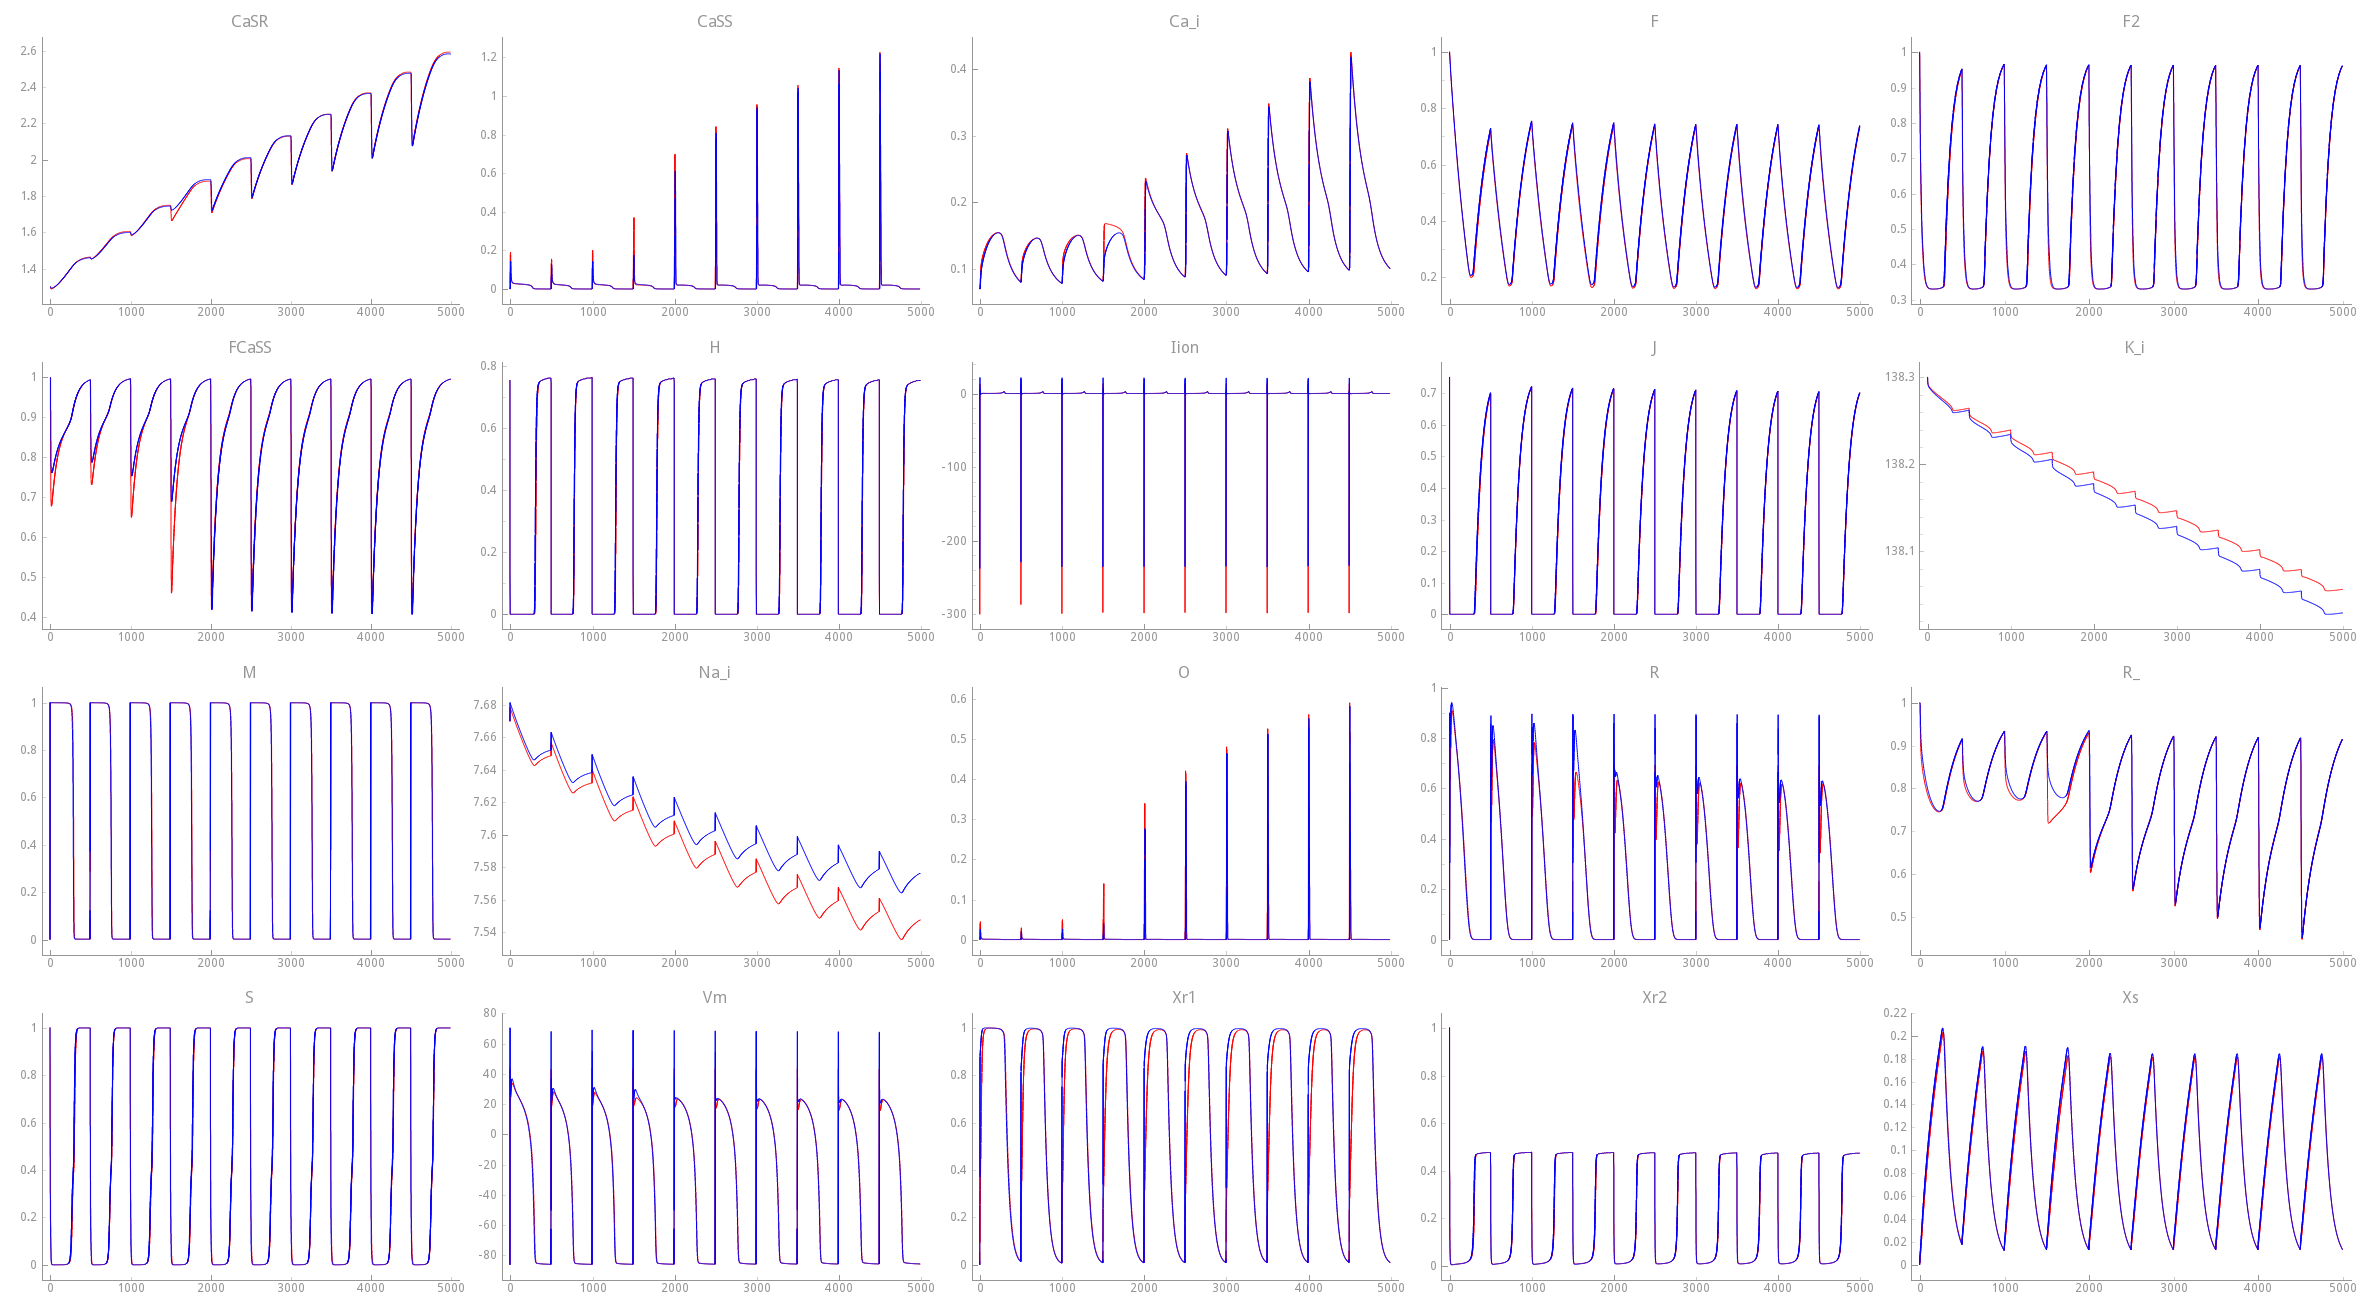
Fig. 171 Comparing TT2 model integrated with time steps of dt=0.01 ms and dt=0.2 ms.
Comparing traces across models
By default, limpetGUI compares traces between two h5 files where correspondence is established based on the names of the state variables. This straight forward approach of establishing correspondence does not work when traces are compared between different models. Names of various states are not consistent across models although they may refer to the same physical quantities. In such cases the establish between traces must be established manually by defining a mapping that can be passed on to limpetGUI. A map follows the simple definition
m   M
j   J
...
fCa f